Homepage Dashboard (Day 18)


Spent today setting up Homepage to organize access to all the URLs I currently have.
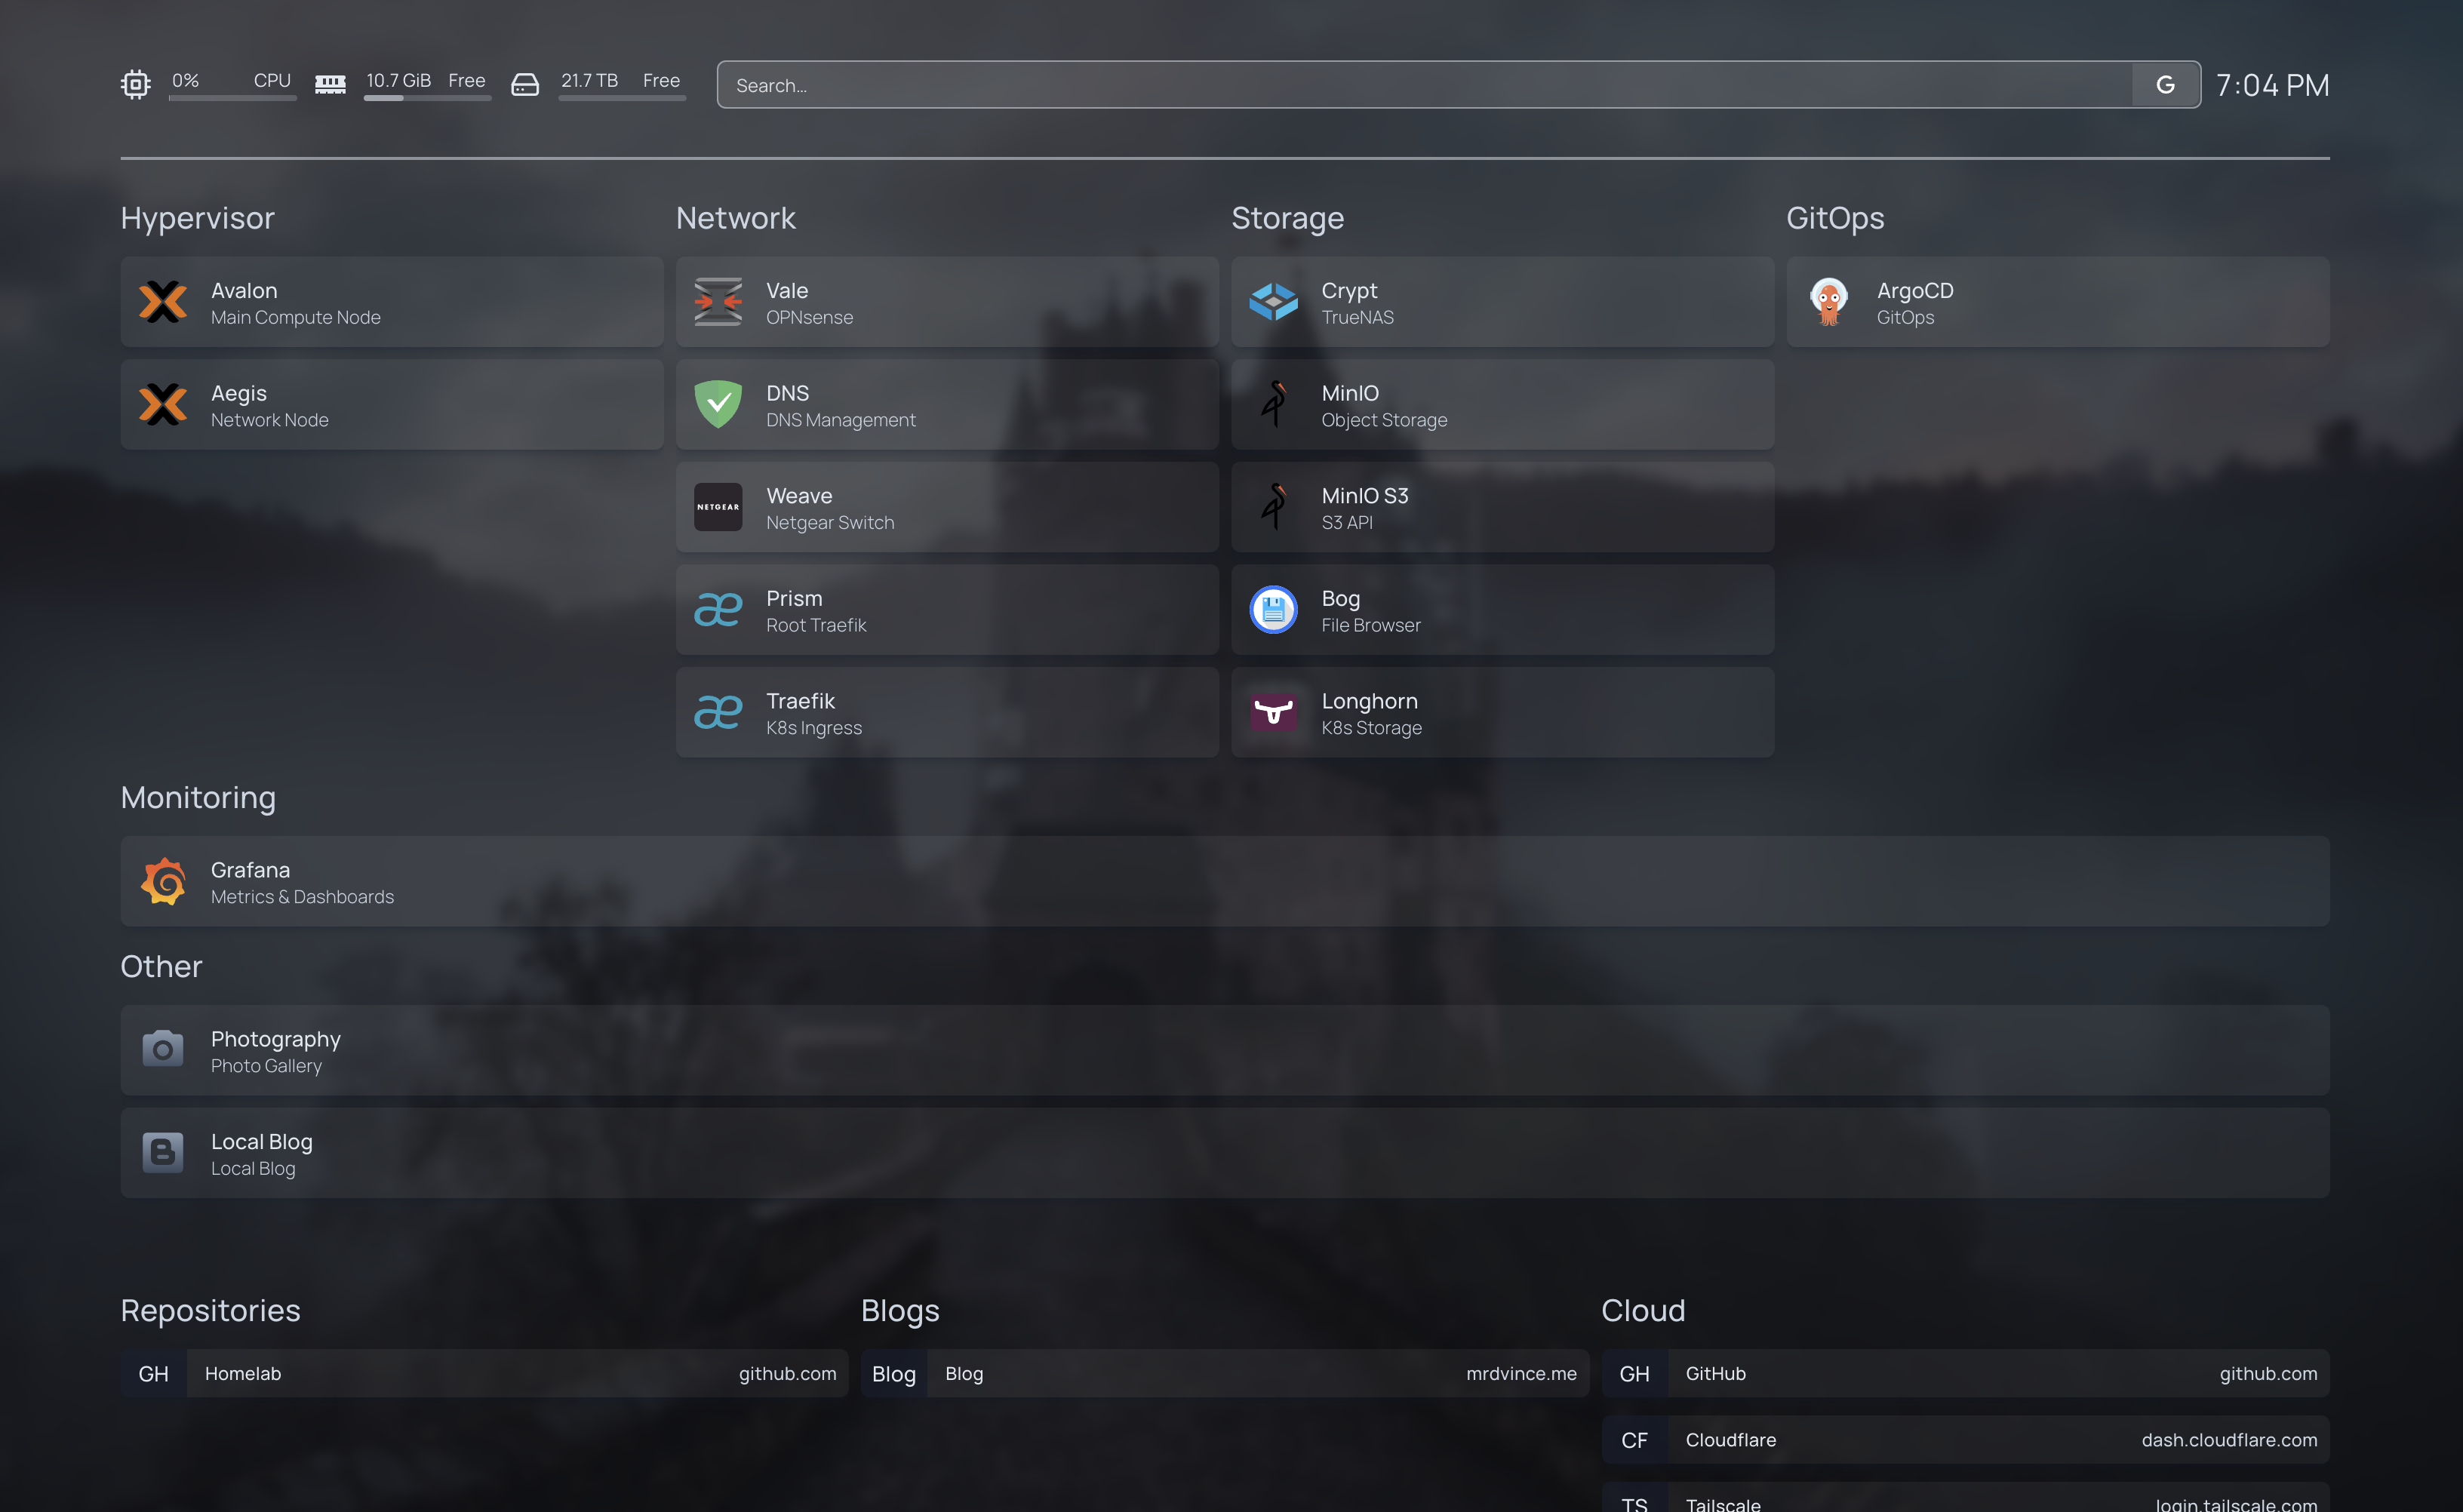
Current dashboard
Basic Configuration
The base setup is defined in the settings.yaml file and looks like this:
title: <Your title name>
theme: dark
color: slate
background:
  image: <image>
  blur: sm
  saturate: 50
  brightness: 50
  opacity: 50
  ....
<rest of config including layouts>
Service Organization
Services are grouped logically, making it easy to find what you need.
For icons, you can use:
- Dashboard Icons Repository
- Material Icons
- Simple Icons
When using material icons or simple icons prefix the icon with e.g mdi-<icon-name> or si-<icon-name>
An example definition in the services.yaml
- Hypervisor:
      - Avalon:
            icon: proxmox.svg
            href: <proxmox url>
            description: Main Compute Node
      - Aegis:
            icon: proxmox.svg
            href: <proxmox url>
            description: Network Node

- Network:
      - Vale:
            icon: opnsense.svg
            href: <url>
            description: OPNsense
      - DNS:
            icon: adguard.svg
            href: <url>
            description: DNS Management
The page auto-refreshes as you edit the config, you see the changes in real-time.
Widgets and Extras
You can also add widgets. e.g showing the time:
- datetime:
    text_size: xl
    format:
      timeStyle: short
And bookmarks for quick access:
- Blogs:
    - Local Blog:
        - abbr: Blog
          href: <your blog url>
I still need to:
- Connect and collect metrics
- And add more detailed service information
For now, it's a functional start that makes navigating between services easier, and the cool thing is you can set it as the default browser landing page.